Monitoring
Observability stack with SLO-driven alerting
Unified metrics, logs, and traces with alerting tied to user experience — so the team catches issues before customers do.
Consumer app at scale
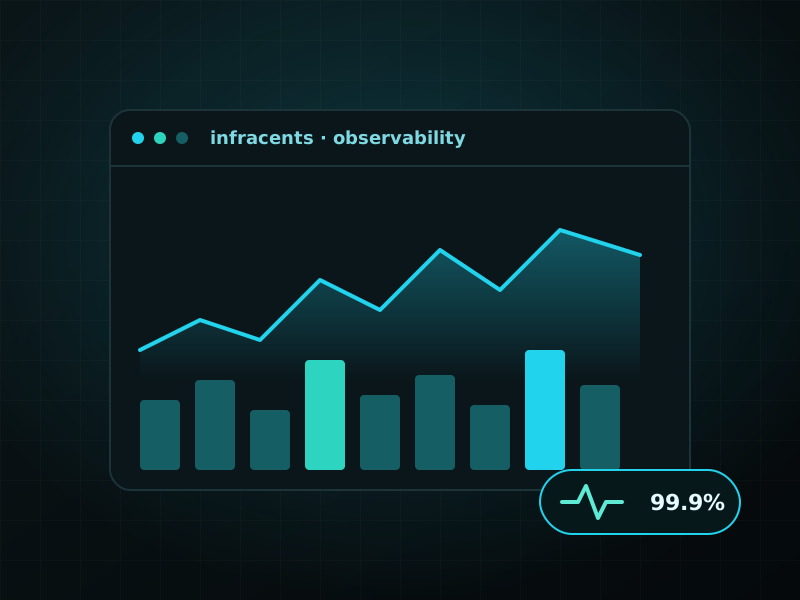
99.9%
Uptime achieved
MTTR↓
Faster recovery
24/7
Coverage
The challenge
Outages were discovered through customer complaints. Dashboards were fragmented and alerts were so noisy the team had learned to ignore them.
Our approach
- Unified metrics, logs, and traces into a single observability stack.
- Defined SLOs and tuned alerts to user-facing reliability — signal over noise.
- Wrote runbooks and set up clear on-call and escalation.
- Ran blameless postmortems to drive down recurring incidents.
Stack used
 Prometheus
 Grafana
 Datadog
 Kubernetes
Let’s map your fastest path forward.
Book a free 30-minute discovery call. We’ll understand your goals and current setup, then come back with a clear, no-obligation plan.